


The global average lower tropospheric temperature anomaly for August, 2011 retreated a little, to +0.33 deg. C
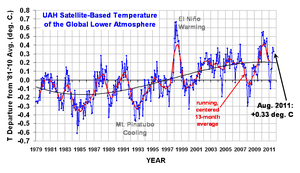
Note that this month I have taken the liberty of adding a 3rd order polynomial fit to the data (courtesy of Excel). This is for entertainment purposes only, and should not be construed as having any predictive value whatsoever.
Here are the stats…we are beginning to see cooling in the tropics from La Nina conditions which are re-emerging there:
YR MON GLOBAL NH SH TROPICS
2011 1 -0.010 -0.055 +0.036 -0.372
2011 2 -0.020 -0.042 +0.002 -0.348
2011 3 -0.101 -0.073 -0.128 -0.342
2011 4 +0.117 +0.195 +0.039 -0.229
2011 5 +0.133 +0.145 +0.121 -0.043
2011 6 +0.315 +0.379 +0.250 +0.233
2011 7 +0.374 +0.344 +0.404 +0.204
2011 8 +0.325 +0.323 +0.327 +0.157
The global sea surface temperatures from AMSR-E through the end of August are shown next. The trend line is, again, for entertainment purposes only:


